Profile of the Running ES Score & Positions of GeneSet Members on the Rank Ordered List
| Dataset | Set_04_transDMproB_versus_transDMpreB.phenotype_transDMproB_versus_transDMpreB.cls #transDMproB_versus_transDMpreB.phenotype_transDMproB_versus_transDMpreB.cls #transDMproB_versus_transDMpreB_repos |
| Phenotype | phenotype_transDMproB_versus_transDMpreB.cls#transDMproB_versus_transDMpreB_repos |
| Upregulated in class | transDMproB |
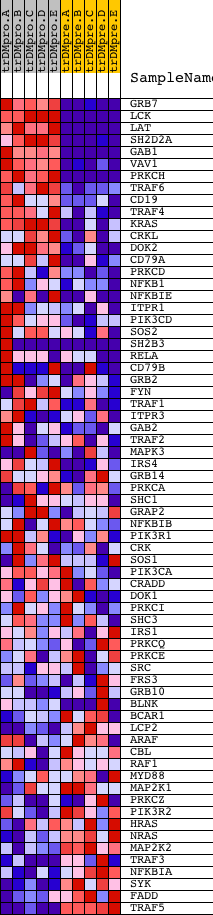
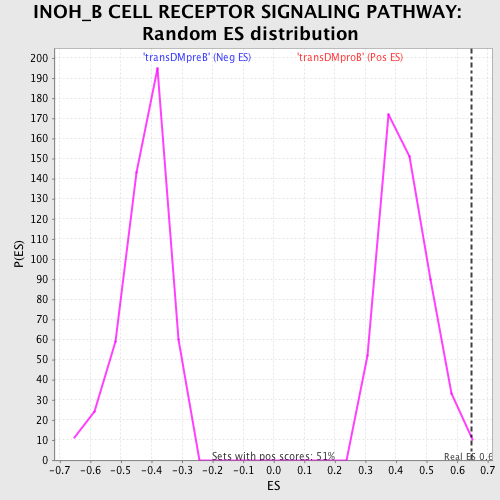
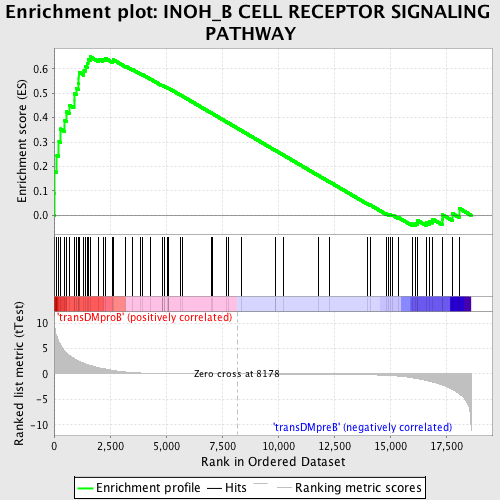
| GeneSet | INOH_B CELL RECEPTOR SIGNALING PATHWAY |
| Enrichment Score (ES) | 0.648765 |
| Normalized Enrichment Score (NES) | 1.502319 |
| Nominal p-value | 0.00984252 |
| FDR q-value | 0.39302814 |
| FWER p-Value | 0.994 |
| PROBE | DESCRIPTION (from dataset) | GENE SYMBOL | GENE_TITLE | RANK IN GENE LIST | RANK METRIC SCORE | RUNNING ES | CORE ENRICHMENT | |
|---|---|---|---|---|---|---|---|---|
| 1 | GRB7 | 20673 | 22 | 9.600 | 0.0912 | Yes | ||
| 2 | LCK | 15746 | 27 | 9.283 | 0.1804 | Yes | ||
| 3 | LAT | 17643 | 124 | 7.317 | 0.2456 | Yes | ||
| 4 | SH2D2A | 6569 | 215 | 6.241 | 0.3009 | Yes | ||
| 5 | GAB1 | 18828 | 280 | 5.825 | 0.3535 | Yes | ||
| 6 | VAV1 | 23173 | 461 | 4.594 | 0.3880 | Yes | ||
| 7 | PRKCH | 21246 | 544 | 4.206 | 0.4241 | Yes | ||
| 8 | TRAF6 | 5797 14940 | 701 | 3.574 | 0.4501 | Yes | ||
| 9 | CD19 | 17640 | 888 | 3.040 | 0.4693 | Yes | ||
| 10 | TRAF4 | 10217 5796 1400 | 889 | 3.037 | 0.4986 | Yes | ||
| 11 | KRAS | 9247 | 987 | 2.779 | 0.5201 | Yes | ||
| 12 | CRKL | 4560 | 1082 | 2.544 | 0.5395 | Yes | ||
| 13 | DOK2 | 354 | 1110 | 2.480 | 0.5619 | Yes | ||
| 14 | CD79A | 18342 | 1111 | 2.480 | 0.5858 | Yes | ||
| 15 | PRKCD | 21897 | 1332 | 2.074 | 0.5939 | Yes | ||
| 16 | NFKB1 | 15160 | 1393 | 1.965 | 0.6096 | Yes | ||
| 17 | NFKBIE | 23225 1556 | 1486 | 1.828 | 0.6222 | Yes | ||
| 18 | ITPR1 | 17341 | 1514 | 1.798 | 0.6381 | Yes | ||
| 19 | PIK3CD | 9563 | 1614 | 1.664 | 0.6488 | Yes | ||
| 20 | SOS2 | 21049 | 2002 | 1.166 | 0.6391 | No | ||
| 21 | SH2B3 | 5001 16383 | 2182 | 1.006 | 0.6392 | No | ||
| 22 | RELA | 23783 | 2280 | 0.956 | 0.6431 | No | ||
| 23 | CD79B | 20185 1309 | 2617 | 0.685 | 0.6316 | No | ||
| 24 | GRB2 | 20149 | 2633 | 0.675 | 0.6373 | No | ||
| 25 | FYN | 3375 3395 20052 | 3206 | 0.359 | 0.6099 | No | ||
| 26 | TRAF1 | 14611 | 3509 | 0.257 | 0.5961 | No | ||
| 27 | ITPR3 | 9195 | 3862 | 0.178 | 0.5789 | No | ||
| 28 | GAB2 | 1821 18184 2025 | 3956 | 0.160 | 0.5754 | No | ||
| 29 | TRAF2 | 14657 | 4297 | 0.111 | 0.5581 | No | ||
| 30 | MAPK3 | 6458 11170 | 4819 | 0.071 | 0.5307 | No | ||
| 31 | IRS4 | 9183 4926 | 4827 | 0.071 | 0.5310 | No | ||
| 32 | GRB14 | 14574 2719 | 4858 | 0.070 | 0.5301 | No | ||
| 33 | PRKCA | 20174 | 4927 | 0.066 | 0.5271 | No | ||
| 34 | SHC1 | 9813 9812 5430 | 4928 | 0.066 | 0.5277 | No | ||
| 35 | GRAP2 | 5113 9398 | 5041 | 0.061 | 0.5223 | No | ||
| 36 | NFKBIB | 17906 | 5100 | 0.059 | 0.5197 | No | ||
| 37 | PIK3R1 | 3170 | 5108 | 0.059 | 0.5199 | No | ||
| 38 | CRK | 4559 1249 | 5115 | 0.059 | 0.5201 | No | ||
| 39 | SOS1 | 5476 | 5642 | 0.043 | 0.4922 | No | ||
| 40 | PIK3CA | 9562 | 5729 | 0.040 | 0.4879 | No | ||
| 41 | CRADD | 19640 | 7046 | 0.016 | 0.4172 | No | ||
| 42 | DOK1 | 17104 1018 1177 | 7081 | 0.015 | 0.4155 | No | ||
| 43 | PRKCI | 9576 | 7682 | 0.007 | 0.3832 | No | ||
| 44 | SHC3 | 21465 | 7797 | 0.005 | 0.3771 | No | ||
| 45 | IRS1 | 4925 | 8350 | -0.002 | 0.3474 | No | ||
| 46 | PRKCQ | 2873 2831 | 9879 | -0.022 | 0.2652 | No | ||
| 47 | PRKCE | 9575 | 9886 | -0.022 | 0.2651 | No | ||
| 48 | SRC | 5507 | 10226 | -0.026 | 0.2471 | No | ||
| 49 | FRS3 | 23209 | 11789 | -0.055 | 0.1634 | No | ||
| 50 | GRB10 | 4799 | 12295 | -0.070 | 0.1368 | No | ||
| 51 | BLNK | 23681 3691 | 13987 | -0.164 | 0.0472 | No | ||
| 52 | BCAR1 | 18741 | 14108 | -0.174 | 0.0424 | No | ||
| 53 | LCP2 | 4988 9268 | 14824 | -0.276 | 0.0066 | No | ||
| 54 | ARAF | 24367 | 14942 | -0.304 | 0.0032 | No | ||
| 55 | CBL | 19154 | 15001 | -0.315 | 0.0031 | No | ||
| 56 | RAF1 | 17035 | 15103 | -0.349 | 0.0010 | No | ||
| 57 | MYD88 | 18970 | 15386 | -0.436 | -0.0100 | No | ||
| 58 | MAP2K1 | 19082 | 15996 | -0.765 | -0.0355 | No | ||
| 59 | PRKCZ | 5260 | 16150 | -0.885 | -0.0352 | No | ||
| 60 | PIK3R2 | 18850 | 16208 | -0.928 | -0.0294 | No | ||
| 61 | HRAS | 4868 | 16218 | -0.935 | -0.0208 | No | ||
| 62 | NRAS | 5191 | 16623 | -1.268 | -0.0304 | No | ||
| 63 | MAP2K2 | 19933 | 16752 | -1.439 | -0.0235 | No | ||
| 64 | TRAF3 | 21147 | 16905 | -1.611 | -0.0161 | No | ||
| 65 | NFKBIA | 21065 | 17327 | -2.139 | -0.0183 | No | ||
| 66 | SYK | 21636 | 17335 | -2.157 | 0.0021 | No | ||
| 67 | FADD | 17536 8950 4711 | 17783 | -3.047 | 0.0074 | No | ||
| 68 | TRAF5 | 13718 | 18095 | -3.894 | 0.0281 | No |